What is RSI indicator ?
RSI stands for Relative Strength Index (RSI). RSI is a technical indicator who measure the momentum in the price. It is generally a momentum oscillator indicator.
Relative Strength Index (RSI)
The Relative Strength Index (RSI), developed by J. Welles Wilder, is a momentum oscillator that measures the speed and change of price movements. The RSI oscillates between zero and 100. Traditionally the RSI is considered overbought when above 70 and oversold when below 30. Signals can be generated by looking for divergences and failure swings. RSI can also be used to identify the general trend.
Wilder features RSI in his 1978 book, New Concepts in Technical Trading Systems. This book also includes the Parabolic SAR, Average True Range, and the Directional Movement Concept (ADX). Despite being developed before the computer age, Wilder’s indicators have stood the test of time and continue to be applied by chart analysts.
RSI Formula
RSI = 100–100 / ( 1 + RS )
RS = Relative Strength = AvgU / AvgD
AvgU = average of all up moves in the last N price bars
AvgD = average of all down moves in the last N price bars
N = the period of RSI
There are 3 different commonly used methods for the exact calculation of AvgU and AvgD (see details below)
How to trade using RSI :
We can trade by many types using RSI like Overbought, Oversold, Bullish Divergence, Bearish Divergence, Hidden Divergence and by many other ways.
Overbought and Oversold Zones :
Traditionally overbought and oversold zone are in RSI are 70 for overbought and 30 for oversold. Overbought and oversold zone means that price has over extended in a particular side and it need to stop moving forward or need to reverse from here or the momentum will be slow in that particular side.
Following image showing overbought and oversold zones in RSI.
RSI Divergences :
RSI shows divergence when the price and RSI is not matching the same direction.
There are three types of divergences :
Bullish Divergence(Positive Divergence)
Bearish Divergence(Negative Divergence)
Hidden Divergence (Trend Continuation)
Bullish Divergence :
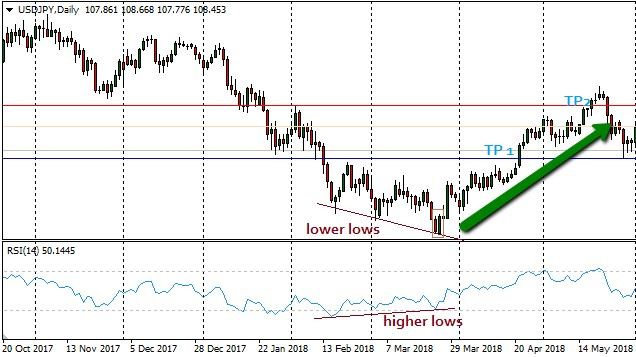
Bullish divergence occur when price make a Lower low but RSI make a higher low in oversold territory, called bullish divergence. Bullish divergence is a signal that market has lost it’s momentum in the downside and it can go sideways or up but will not fall in same way it was falling priorly.
Bearish Divergence :
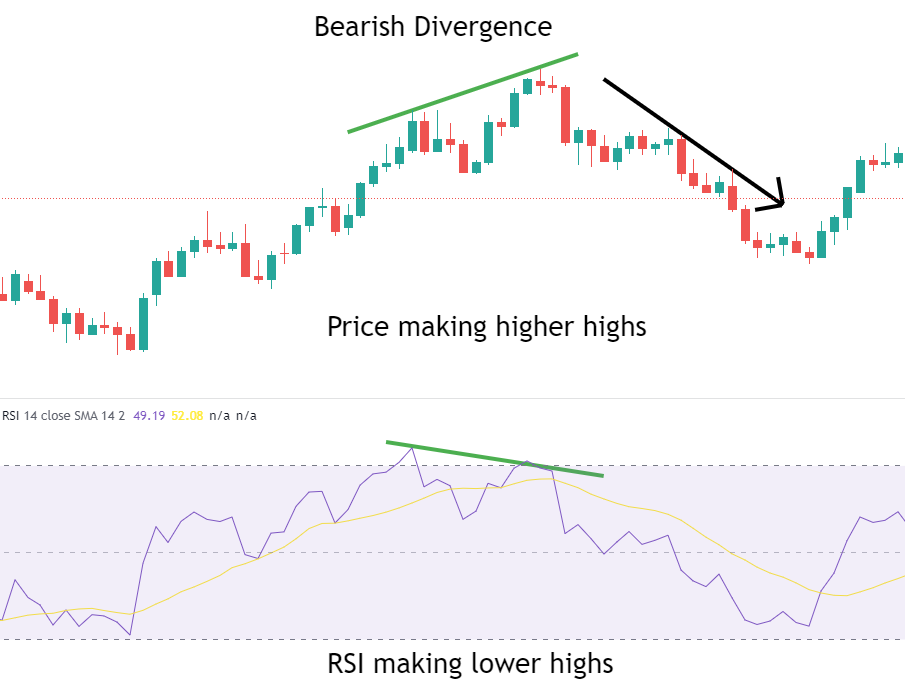
Bearish divergence occur when price make a higher high but RSI make a lower high in overbought territory, called bearish divergence. Bearish divergence is a signal that market has lost it’s momentum in the upside and it can go sideways or down but will not rally up in same way it was rallying priorly.
Hidden Divergence :
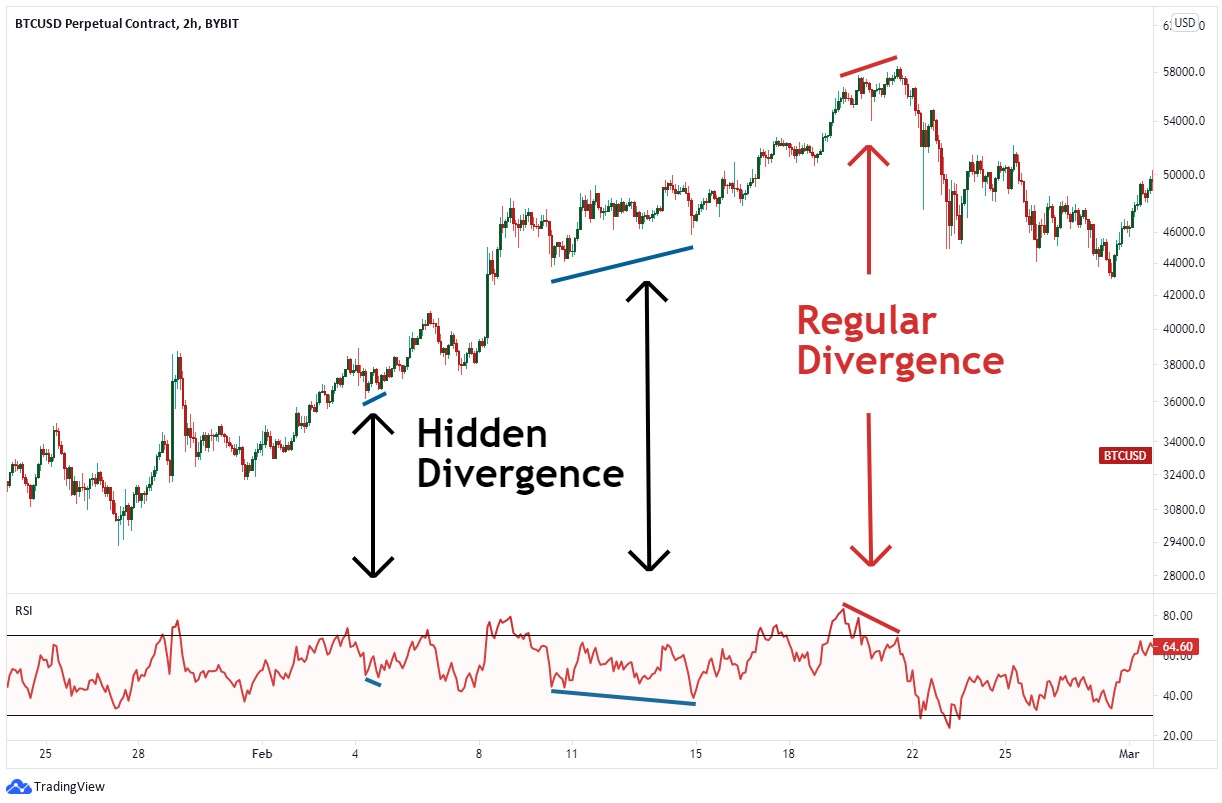
Hidden divergence is occur in the natural zone of RSI. Hidden divergence is generally a trend continuation divergence, which signal towards the trend.
This is how a RSI can help you to ride the trends and make you money.
If you want to master RSI following books can help you to master it -
Follow for more -


